P.3 Simulating Control Systems Using Simulink
In this appendix we will show how to simulate the feedback control of a dynamic system using Simulink. Consider the general feedback control system shown in Figure 3.1. The output of the physical system is \(y(t)\), and the inputs to the physical system are \(u(t)\) and an external disturbance signal \(d(t)\). The output of the system \(y(t)\) is corrupted by zero-mean noise \(n(t)\). The inputs to the controller are the reference signal \(r(t)\) and the output corrupted by noise.
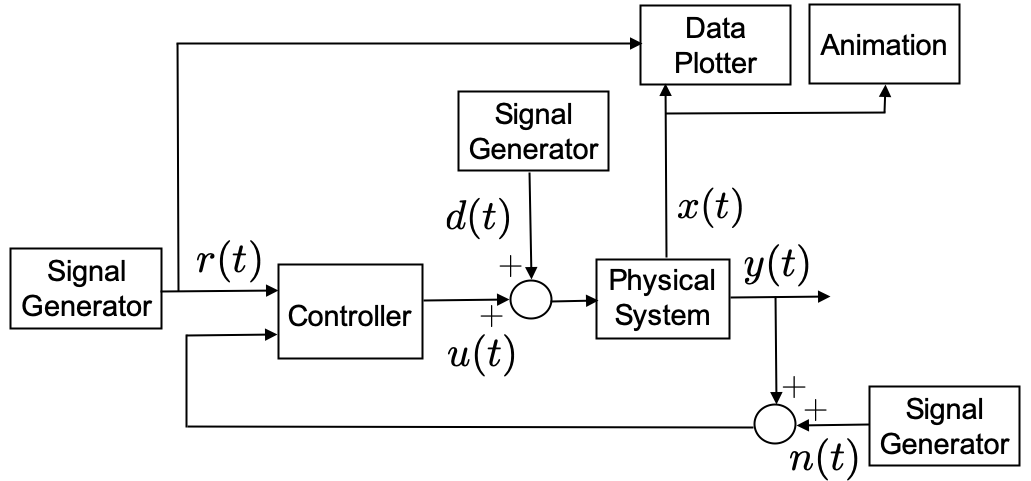
We will illustrate how to implement feedback control systems in
Simulink by simulating the physical system described by the
differential equation \[\tag{P.3.1}
\ddot{y} + 2\dot{y} + 3 y = 4 u,\] and using the PID controller
\[\tag{P.3.2}
u(t) = k_p (r(t)-y(t)) + k_i \int_{-\infty}^t (r(\tau)-y(\tau))d\tau -
k_d \dot{y}.\]
The Simulink diagram that corresponds to Figure 3.1 is shown in Figure 3.2.
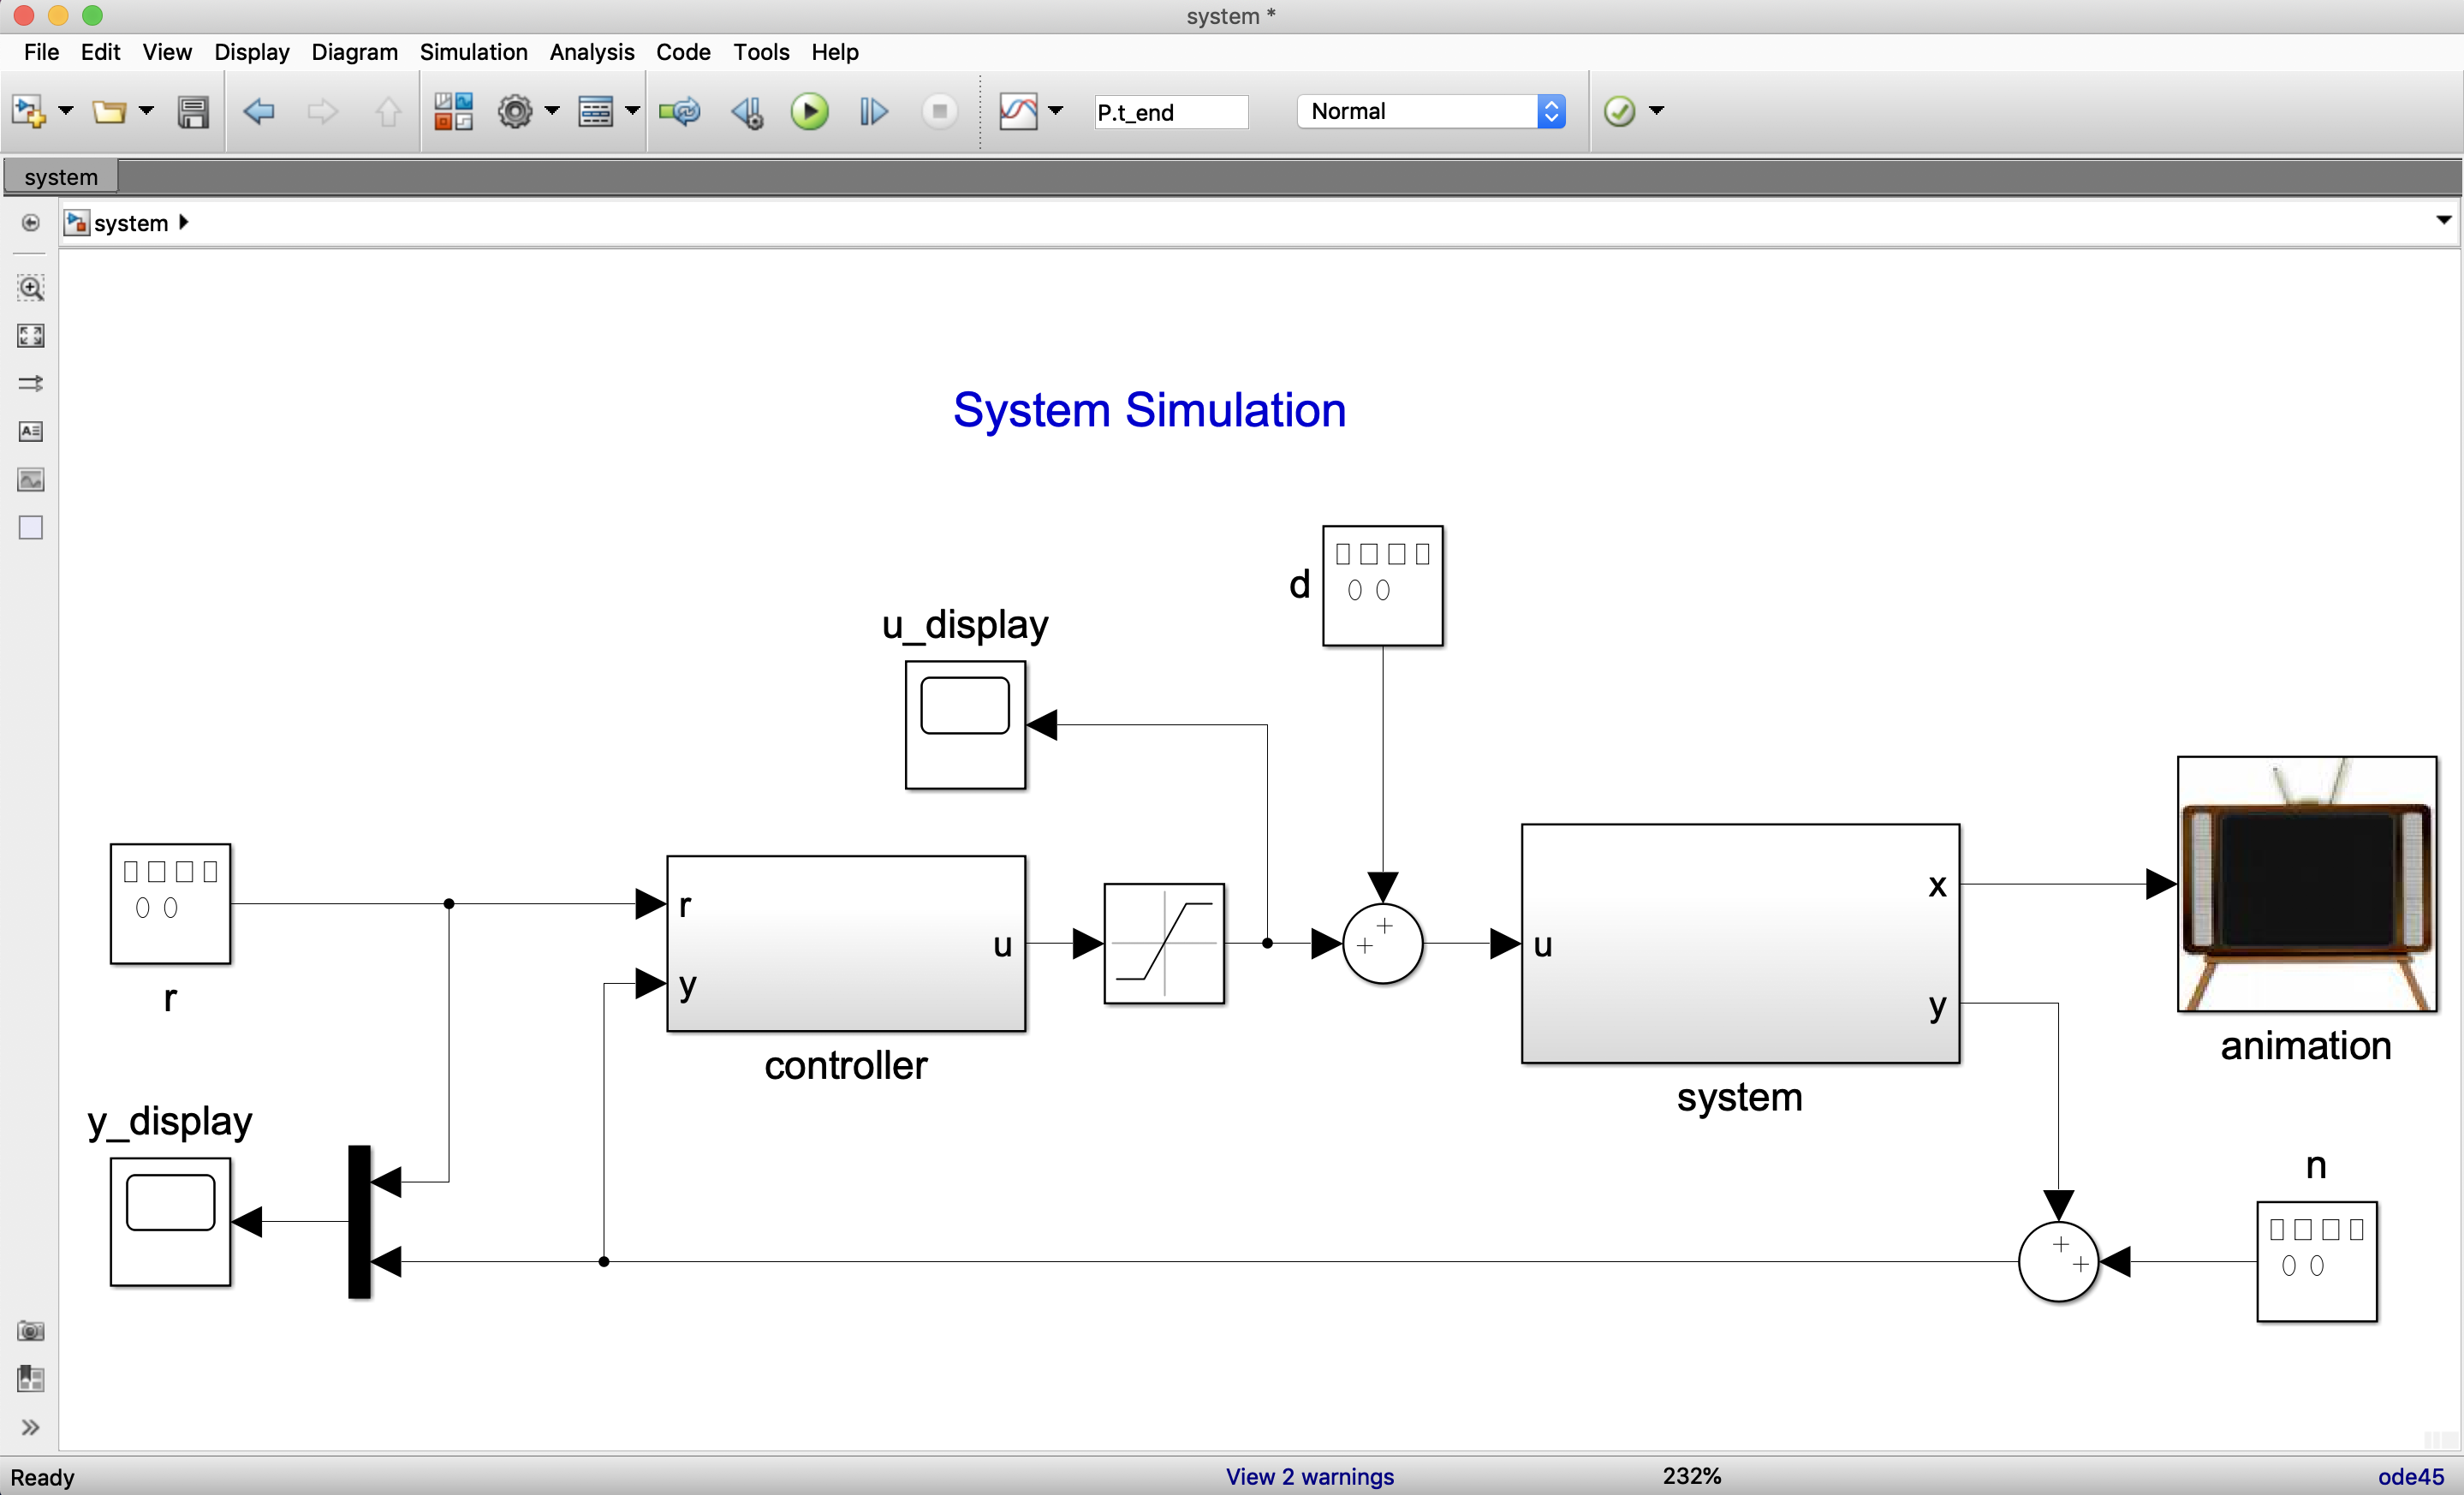
The system dynamics are implemented in the system block,
the controller is implemented in the controller block, and
the animation is implemented in the animation block. The
reference \(r(t)\), the disturbance
\(d(t)\), and the noise \(n(t)\) are all implemented using the
built-in Simulink Signal Generator block. The built-in
Simulink Scope blocks are used to display the output \(y\) and the reference \(r\), as well as the input \(u\).
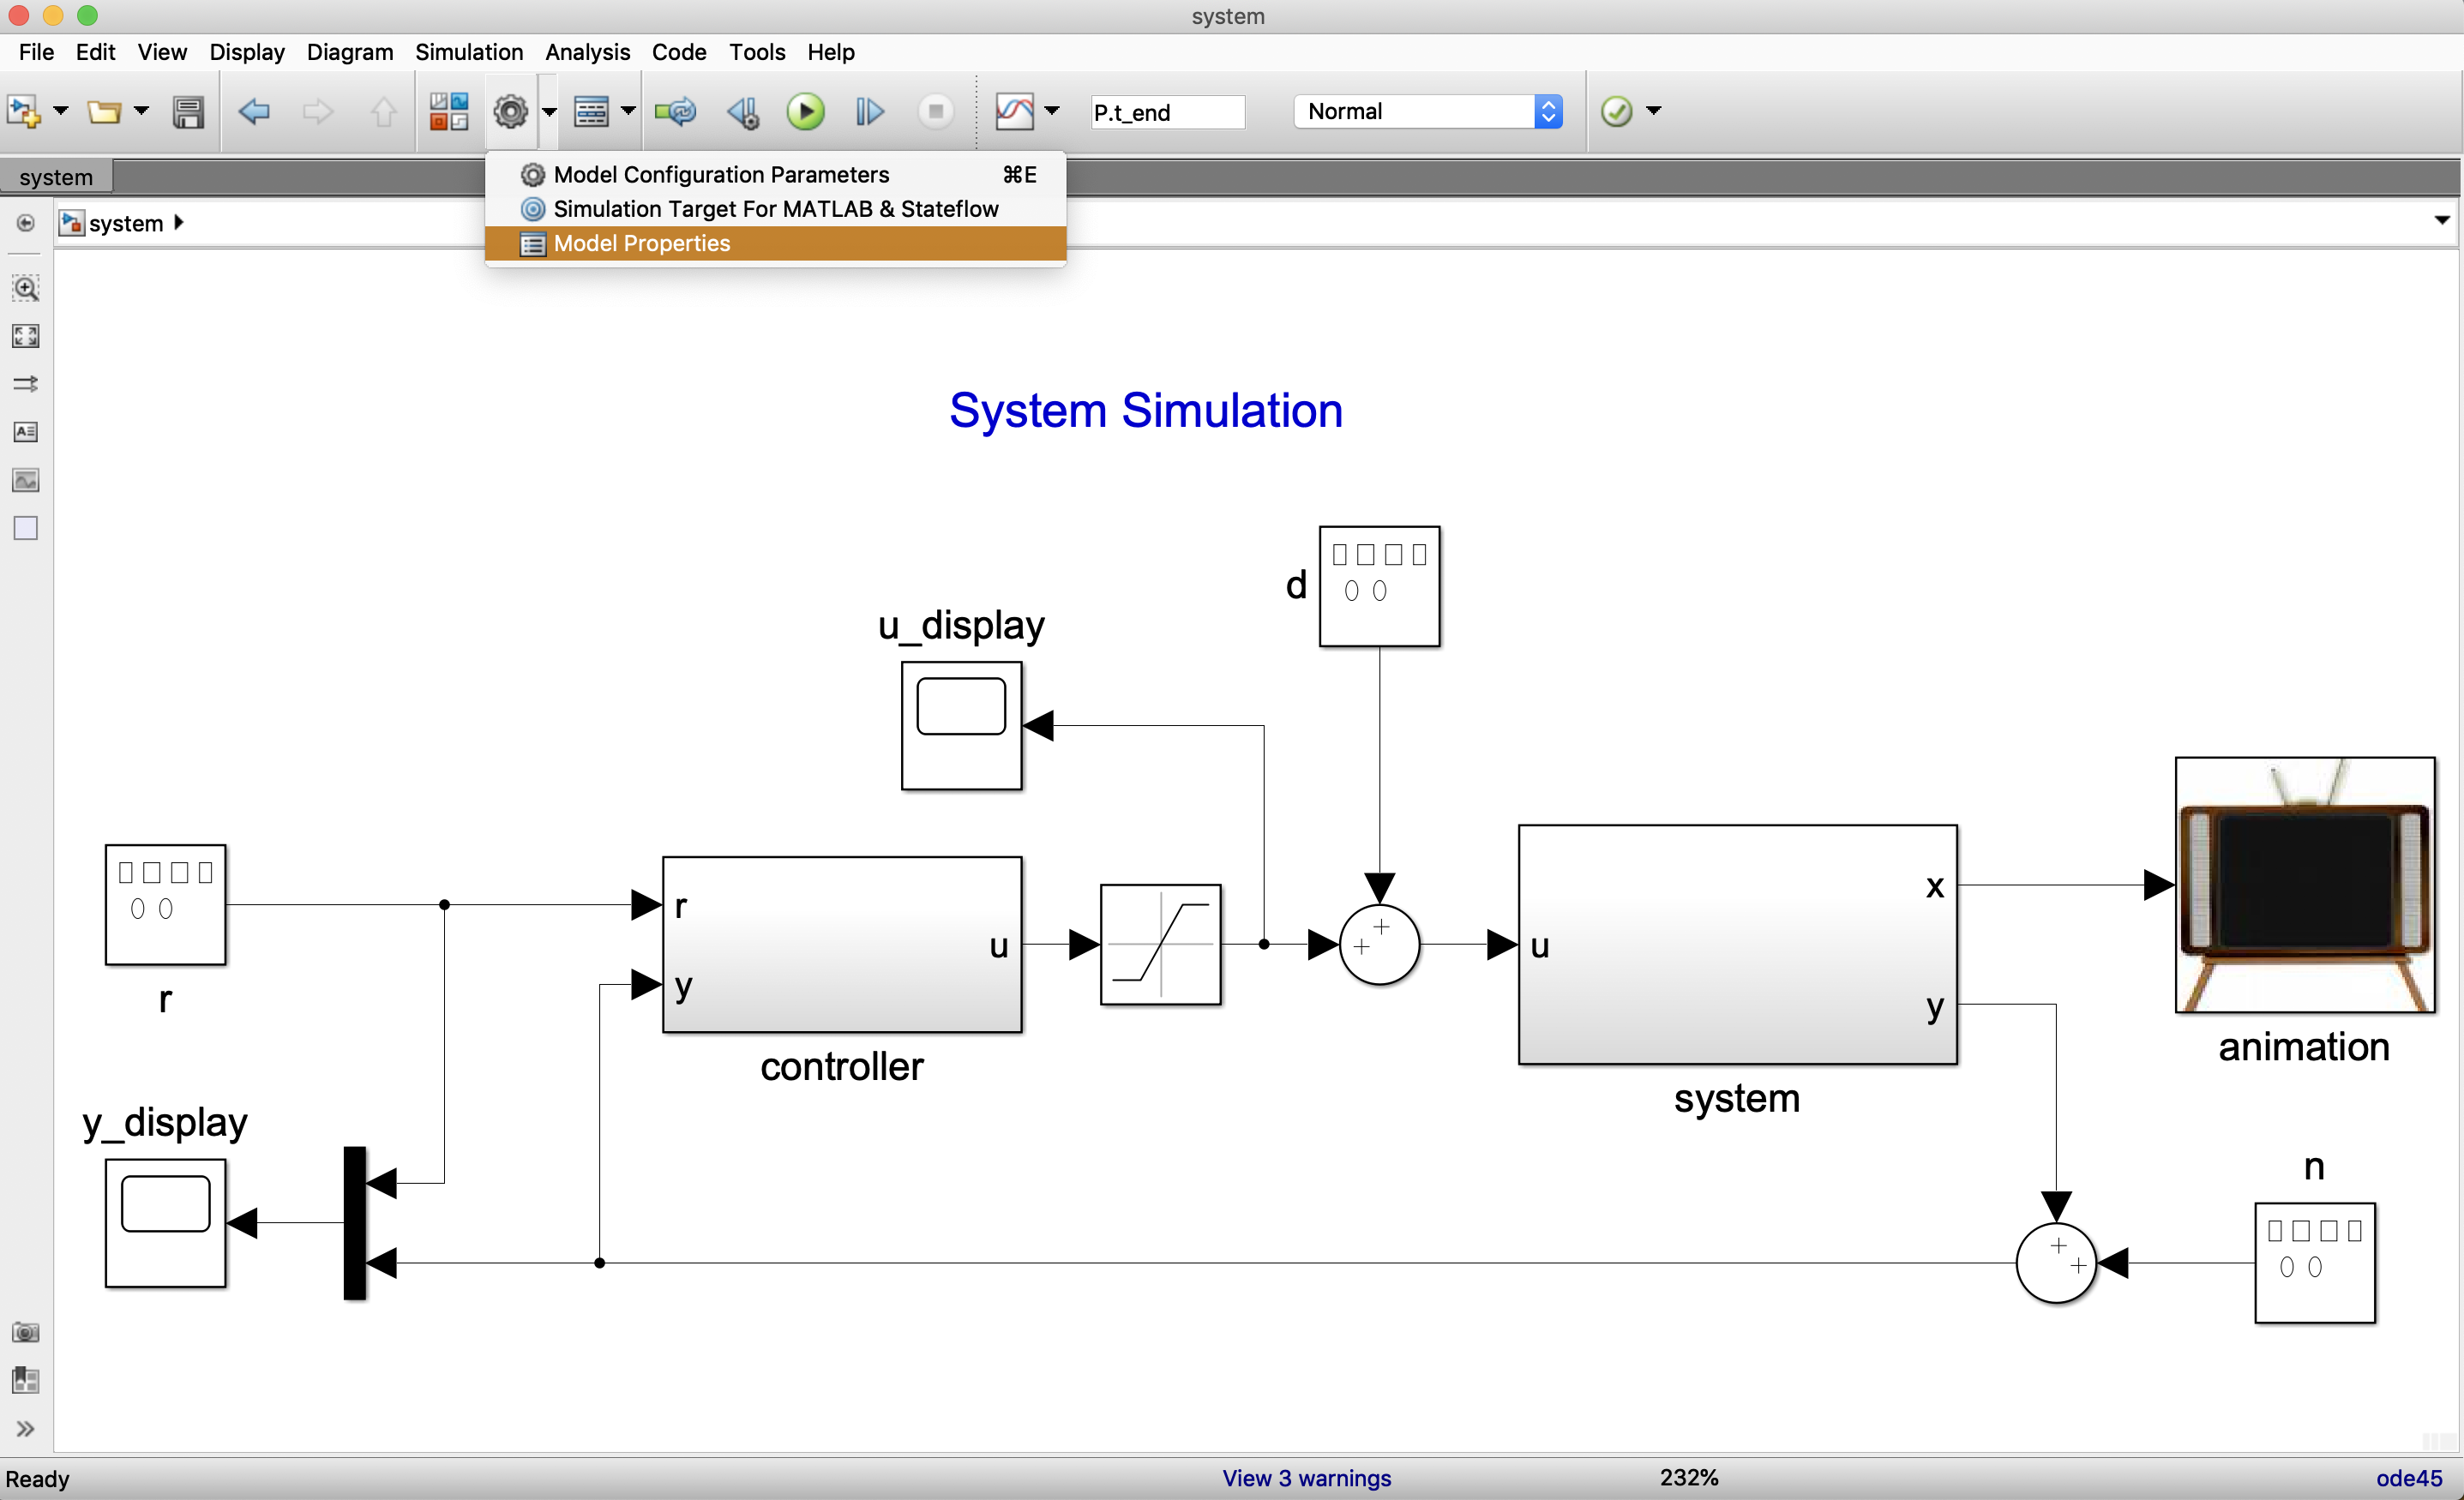
System parameters can be loaded into Simulink at the beginning of a
simulation by clicking on the Model Properties menu, as
shown in
Figure 3.3,
and then selecting Callbacks/InitFcn, as shown in
Figure 3.4.
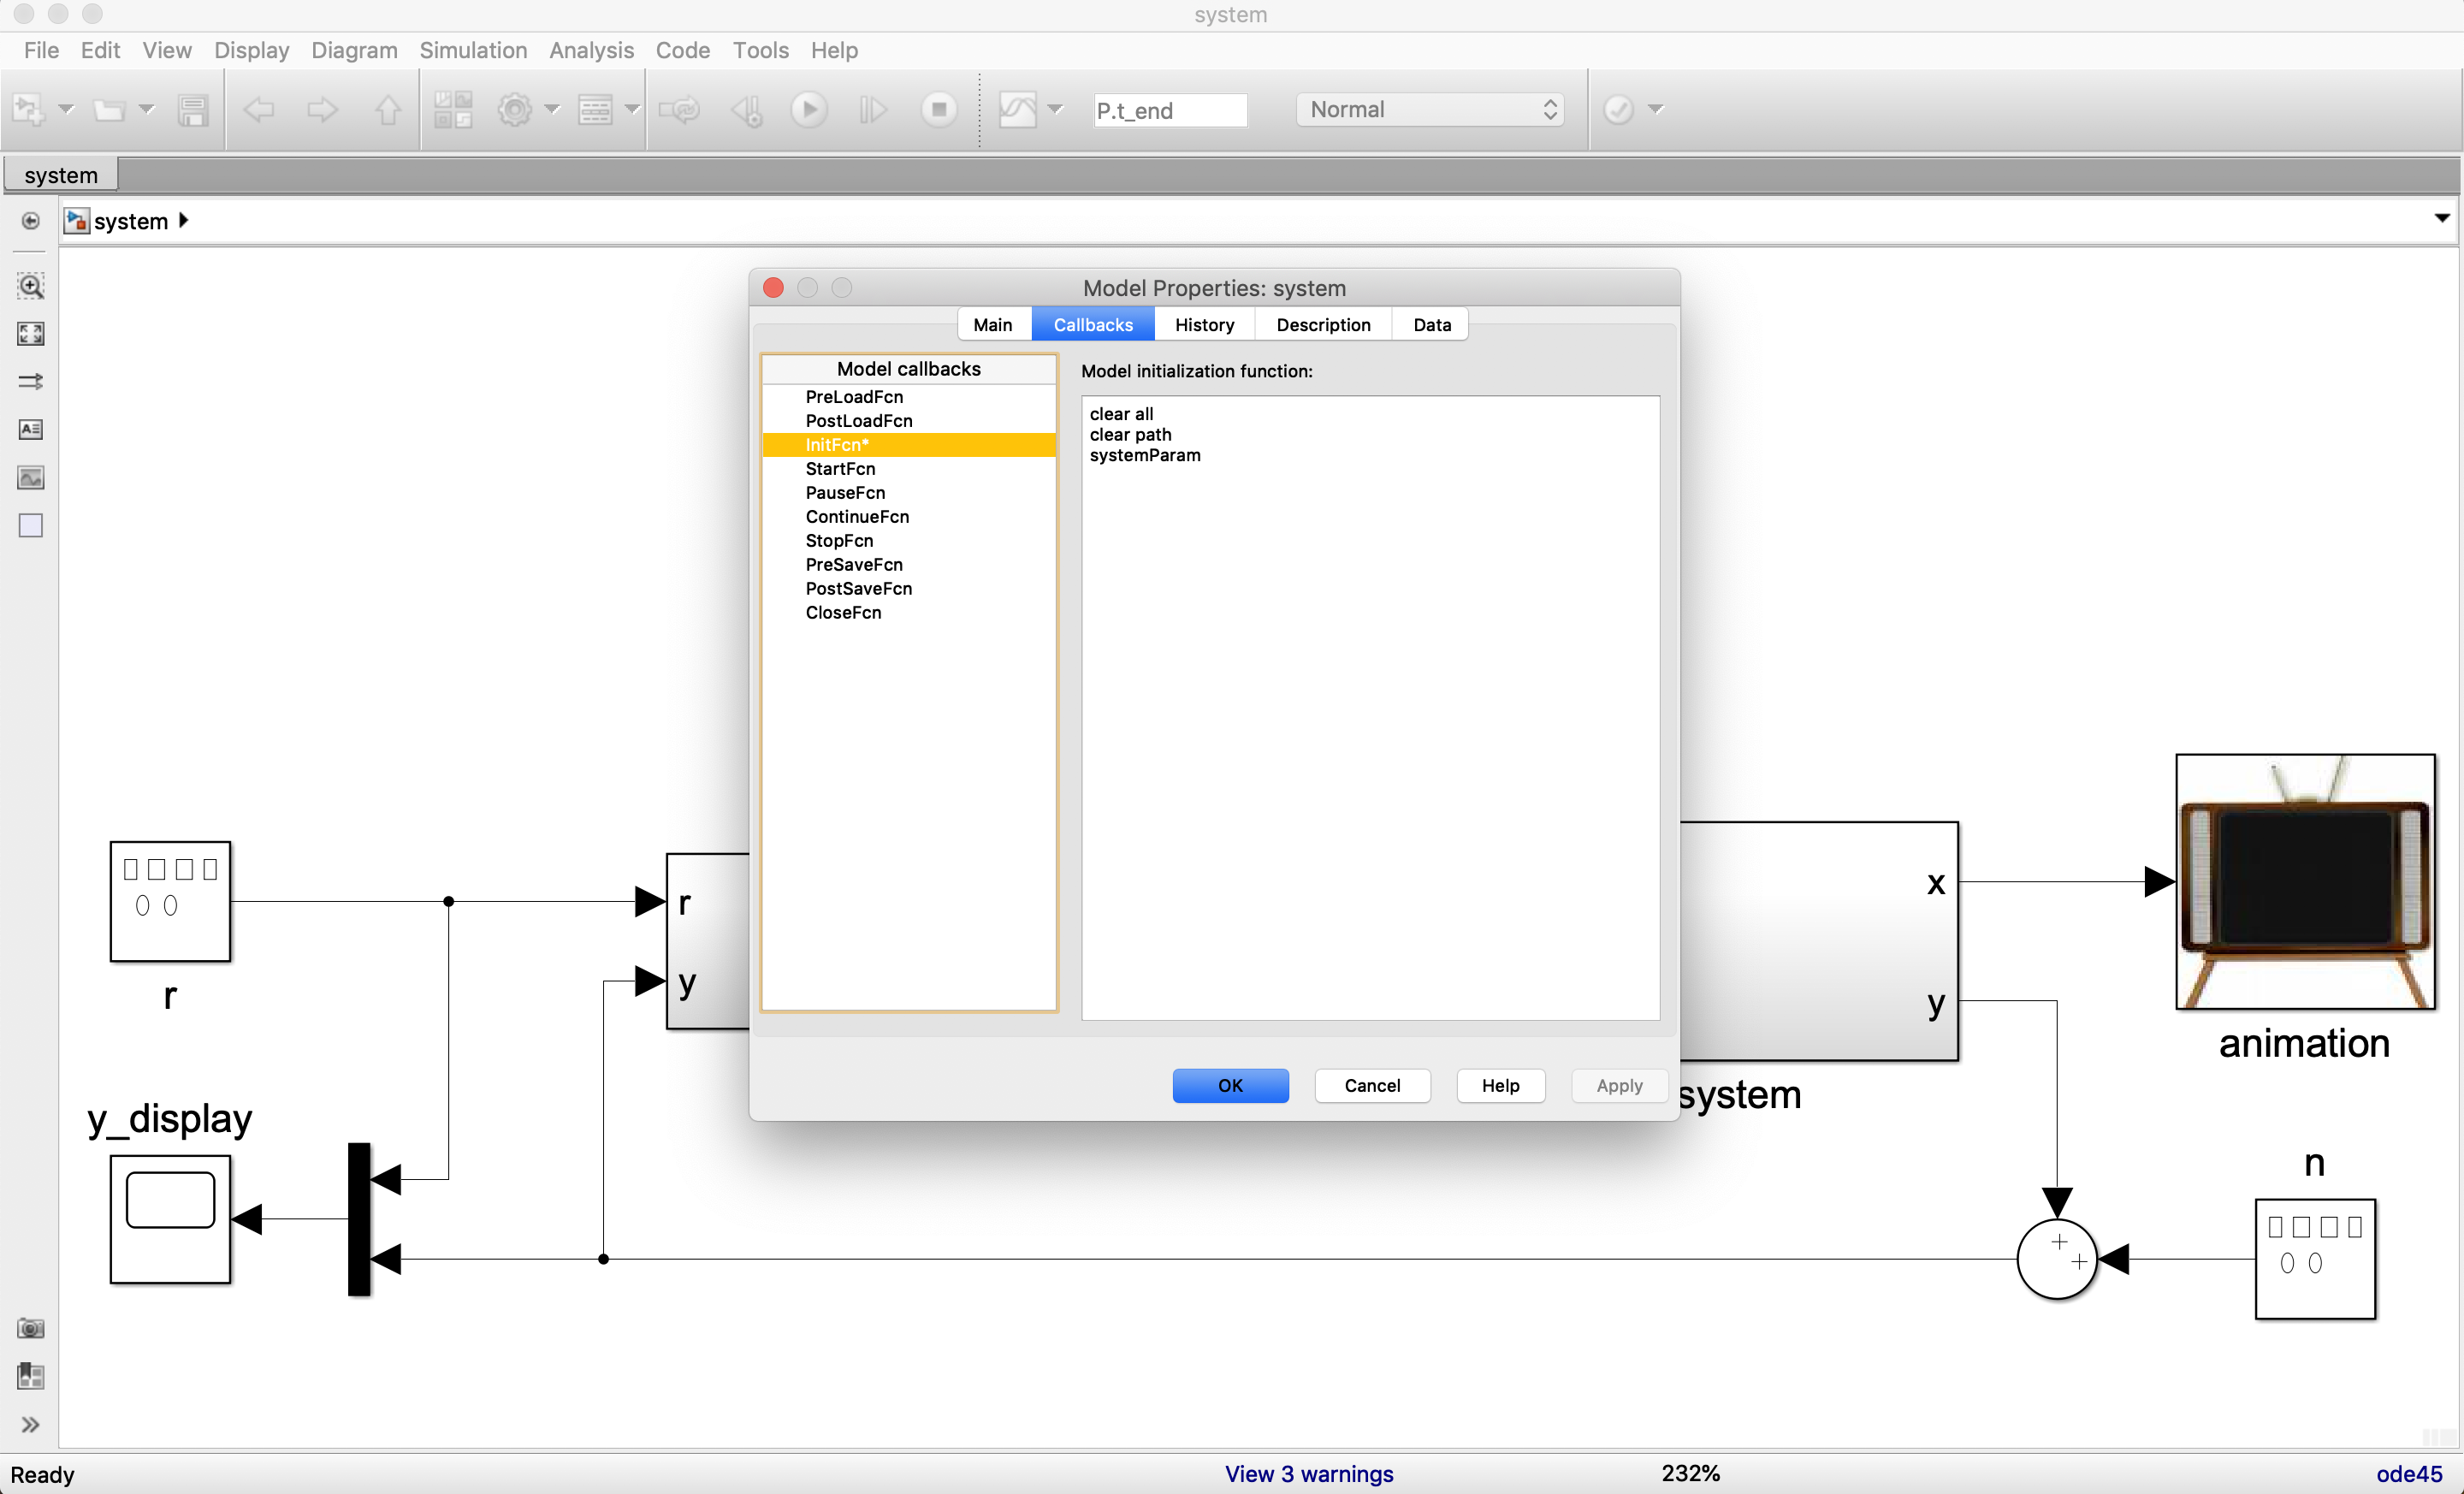
The commands listed under Model initialization function:
are executed at the beginning of each Simulink simulation.
P.3.1 System Dynamics
In this section we will describe how to implement the system
dynamics. Double-clicking the system block shown in
Figure 3.2 results in the
Simulink sub-diagram shown in
Figure 3.5.
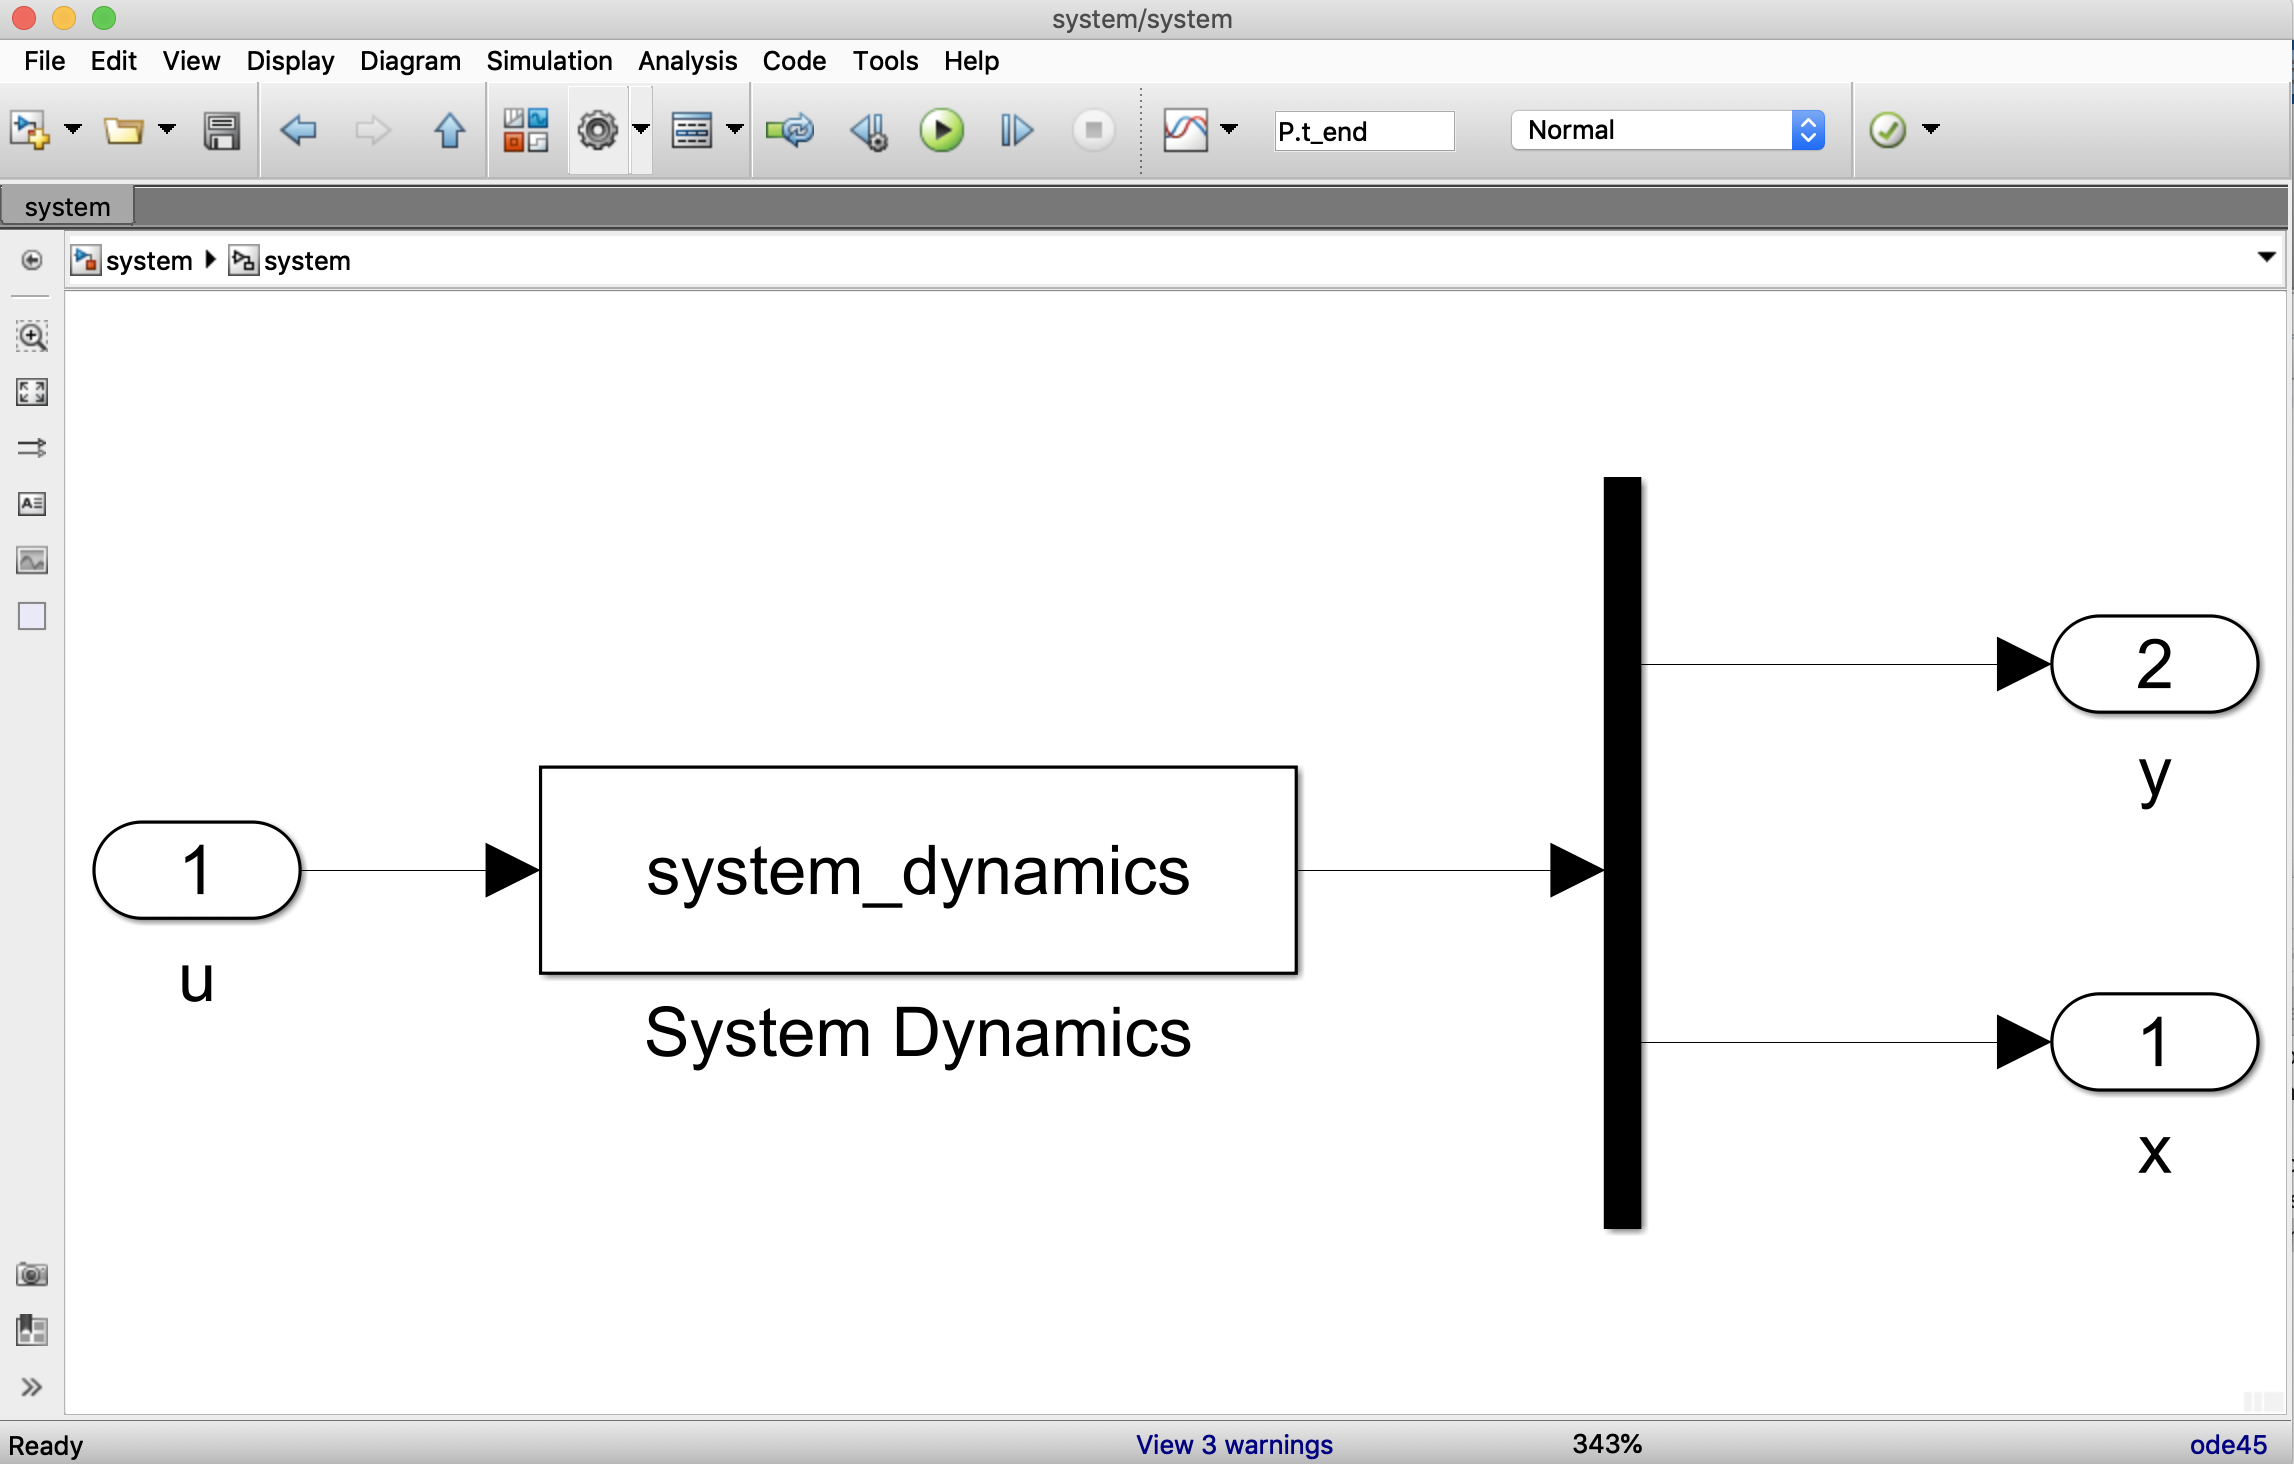
Double-clicking the System Dynamics block results in
Figure 3.6, which shows an
s-function dialog block.
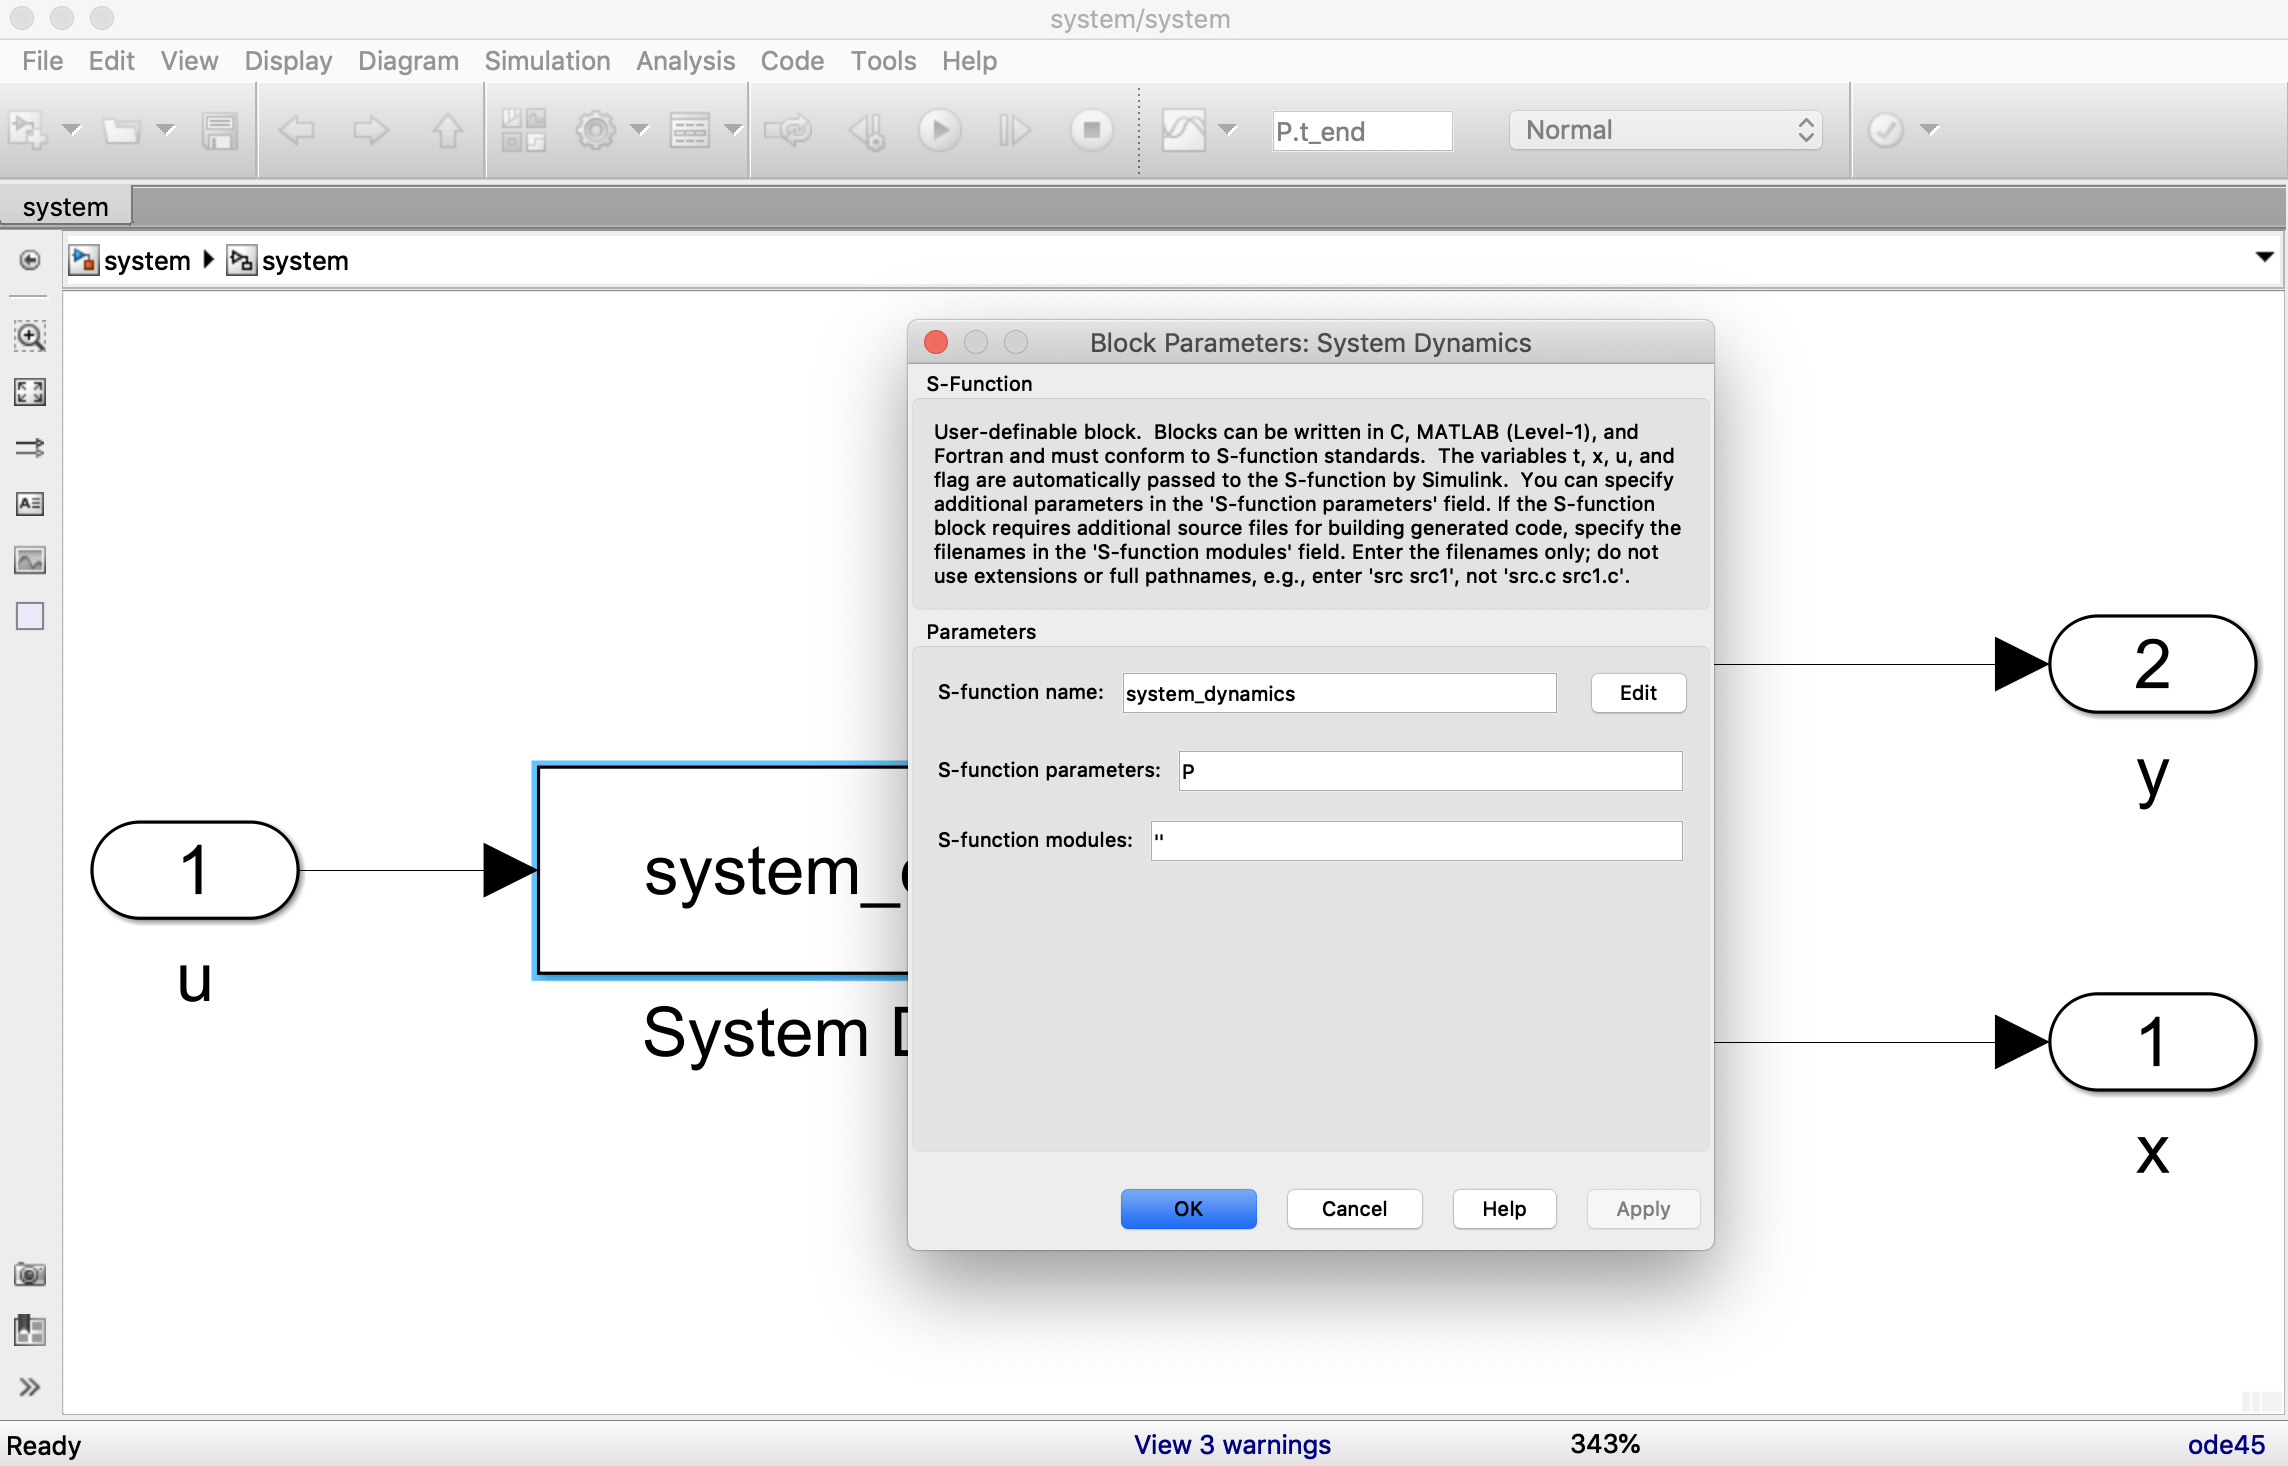
In Simulink, system dynamics are implemented using
s-functions. Simulink is essentially a sophisticated tool
for solving interconnected hybrid ordinary differential and difference
equations. Each block in Simulink is assumed to have the structure \begin{align}
\dot{x}_c &= f(t, x_c, x_d, u); \qquad x_c(0) = x_{c0}
\tag{P.3.3} \\
x_d[k+1] &= g(t, x_c, x_d, u); \qquad x_d[0] = x_{d0}
\tag{P.3.4} \\
y &= h(t, x_c, x_d, u) \tag{P.3.5} ,
\end{align} where \(x_c\in{\mathbb{R}}^{n_c}\) is a continuous
state with initial condition \(x_{c0}\), \(x_d\in{\mathbb{R}}^{n_d}\) is a discrete
state with initial condition \(x_{d0}\), \(u\in{\mathbb{R}}^m\) is the input to the
block, \(y\in{\mathbb{R}}^p\) is the
output of the block, and \(t\) is the
elapsed simulation time. An s-function is a Simulink tool for explicitly
defining the functions \(f\), \(g\), and \(h\) and the initial conditions \(x_{c0}\) and \(x_{d0}\). As explained in the
MATLAB/Simulink documentation, there are several methods for specifying
an s-function. In this section, we
provide an overview of the method that uses a Level-1 M-file
s-function.
The system given in Equation P.3.1 is implemented using the s-function shown below.
function [sys,x0,str,ts,simStateCompliance]...
    =system_dynamics(t,x,u,flag)
switch flag
  case 0  % Initialize block
    [sys,x0,str,ts,simStateCompliance]=mdlInitializeSizes;
  case 1  % define xdot = f(t,x,u)
    sys=mdlDerivatives(t,x,u);
  case 3  % define y = h(t,x,u)
    sys=mdlOutputs(t,x,u);
  % GetTimeOfNextVarHit
  otherwise
    DAStudio.error(...
        'Simulink:blocks:unhandledFlag',num2str(flag));
end
%==============================================
function [sys,x0,str,ts,simStateCompliance]=mdlInitializeSizes
sizes = simsizes;
sizes.NumContStates  = 2;
sizes.NumDiscStates  = 0;
sizes.NumOutputs     = 1+2;
sizes.NumInputs      = 1;
sizes.DirFeedthrough = 0;
sizes.NumSampleTimes = 1;
sys = simsizes(sizes);

% define initial conditions
y0 = 0;  % initial condition for y
ydot0 = 0;  % initial condition for ydot
x0  = [y0; ydot0];
str = [];  % str is always an empty matrix
% initialize the array of sample times
ts  = [0 0];
simStateCompliance = 'UnknownSimState';

%==============================================
function sys=mdlDerivatives(t,x,u)
    % Return xdot = f(x,u)
    y = x(1);
    ydot = x(2);

    % system parameters
    persistent a0
    persistent a1
    persistent b0
    if t==0
        a0 = 3.0;
        a1 = 2.0;
        b0 = 4.0;
        % modify the system parameters by random value
        alpha = 0.2;  % Uncertainty parameter
        a0 = a0 * (1+2*alpha*rand-alpha);
        a1 = a1 * (1+2*alpha*rand-alpha);
        b0 = b0 * (1+2*alpha*rand-alpha);
    end
    % The equations of motion.
    yddot = -a1 * ydot - a0 * y + b0 * u;
    % build xdot and return
    sys = [ydot; yddot];

%==============================================
function sys=mdlOutputs(t, x, u)
    y = x(1);
    sys = [y; x];  % return output and state
Lines 1–2 define the main s-function file. The inputs to this
function are always the elapsed time \(t\); the state \(x\), which is a concatenation of the
continuous state and discrete state; the input \(u\); and a flag, followed by
user-defined input parameters, which are absent in this case. The
Simulink engine calls the s-function and passes the parameters \(t\), \(x\), \(u\), and flag. When
flag==0, the Simulink engine expects the s-function to
return the structure sys, which defines the block; initial
conditions x0; an empty string str; and an
array ts that defines the sample times of the block. When
flag==1, the Simulink engine expects the s-function to
return the function \(f(t,x,u)\), and
when flag==3, the Simulink engine expects the s-function to
return \(h(t,x,u)\). The switch
statement that calls the proper functions based on the value of
flag is shown in Lines 3–13. The block setup and the
definition of the initial conditions are shown in Lines 16–33. The
numbers of continuous states, discrete states, outputs, and inputs are
defined on Lines 18–21. The direct feedthrough term on Line 22 is set to
one if the output depends explicitly on the input \(u\). For example, this occurs if \(D\neq 0\) in the linear state-space output
equation \(y=Cx+Du\). The initial
conditions are defined on Lines 26–29. The sample times are defined on
Line 32. The format for this line is ts = [period offset],
where period defines the sample period and is \(0\) for continuous time or \(-1\) for inherited, and where
offset is the sample time offset, which is typically \(0\). The function \(f(t,x,u)\) is defined in Lines 36–58, and
the output function \(h(t,x,u)\) is
defined in Lines 61–63.
P.3.2 Controller
In this section we will describe how to implement the controller.
Double-clicking the controller block shown in
Figure 3.2 results in the
Simulink sub-diagram shown in
Figure 3.7, which also shows
the pop-up window that results from clicking the
Interpreted MATLAB Function block.
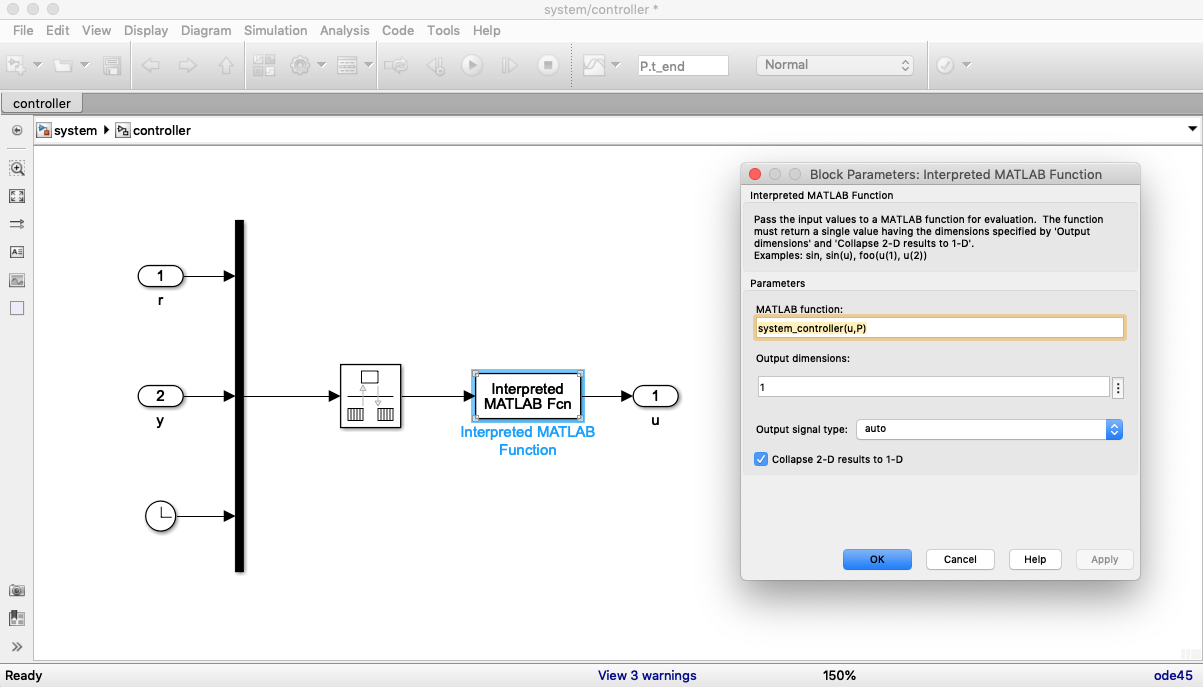
This block calls the MATLAB function system_controller.m
with inputs u, coming into the Simulink block, and the
parameter structure P, which must be defined in the MATLAB
workspace. The m-file that defines the controller is listed below.
function u=system_controller(in, Ts)
    r   = in(1);
    y   = in(2);
    t   = in(3);
    % controller gains
    kp = 1;
    kd = 1;
    ki = 1;
    sigma = 2*Ts;
    beta = (2*sigma-Ts)/(2*sigma+Ts);
    limit = 1;

    % define the error
    error = r - y;

    % set persistent variables at start of simulation
    persistent integrator
    persistent ydot
    persistent error_d1
    persistent y_d1
    if t<Ts
        integrator = 0;
        ydot = 0;
        error_d1 = error;
        y_d1 = y;
    end

    % update the integrator
    integrator = integrator + (Ts/2)*(error+error_d1);
    % update the derivative of y
    ydot = beta*ydot + (1-beta)*(y-y_d1)/Ts;
    % form PID controller, saturate, and return
    u_unsat = kp*error + ki*integrator - kd*ydot;
    u = saturate(u_unsat, limit);
    % update persistent delay variables
    error_d1 = error;
    y_d1 = y;
end

%-----------------------------------------------------------------
% saturation function
function out = sat(in,limit)
    if     in > limit,      out = limit;
    elseif in < -limit,     out = -limit;
    else                    out = in;
    end
end
The inputs to system_controller.m are in
and the sample rate Ts. The input array is decomposed into
the reference \(r\), the system output
\(y\), and the time \(t\) on lines 2–4. The controller gains are
set on lines 5–11, and the error is calculated on line 14. The
persistent variables that must persist between function calls are
defined and initialized on lines 16–26. The integrator is updated on
line 29, the differentiator is updated on line 31, and the PID
controller is specified on lines 33–34. The delay variables are updated
on lines 36–37.
P.3.3 Animation
In this section we will show how to create an animation for the inverted pendulum case study in Simulink.
When a graphics function like plot is called in MATLAB,
the function returns a handle to the plot. A graphics handle is
similar to a pointer in C/C++ in the sense that all of the properties of
the plot can be accessed through the handle. For example, the MATLAB
command
>> plot_handle=plot(t,sin(t))returns a pointer, or handle, to the plot of sin(t).
Properties of the plot can be changed by using the handle, rather than
reissuing the plot command. For example, the MATLAB
command
>> set(plot_handle, 'YData', cos(t))changes the plot to cos(t) without redrawing the axes,
title, label, or other objects that may be associated with the plot. If
the plot contains drawings of several objects, a handle can be
associated with each object. For example,
    >> plot_handle1 = plot(t,sin(t))
    >> hold on
    >> plot_handle2 = plot(t,cos(t))
draws both sin(t) and cos(t) on the same
plot, with a handle associated with each object. The objects can be
manipulated separately without redrawing the other object. For example,
to change cos(t) to cos(2t), issue the
command
>> set(plot_handle2, 'YData', cos(2*t))We can exploit this property to animate simulations in Simulink by redrawing only the parts of the animation that change in time, and thereby significantly reducing the simulation time. To show how handle graphics can be used to produce animations in Simulink, we will show how to draw the inverted pendulum in a 2-D animation.
Consider the image of the inverted pendulum shown in Fig. 3.8, where the configuration is completely specified by the position of the cart \(z\), and the angle of the rod from vertical \(\theta\). The physical parameters of the system are the rod length \(\ell\), the base width \(w\), the base height \(h\), and the gap between the base and the track \(g\).
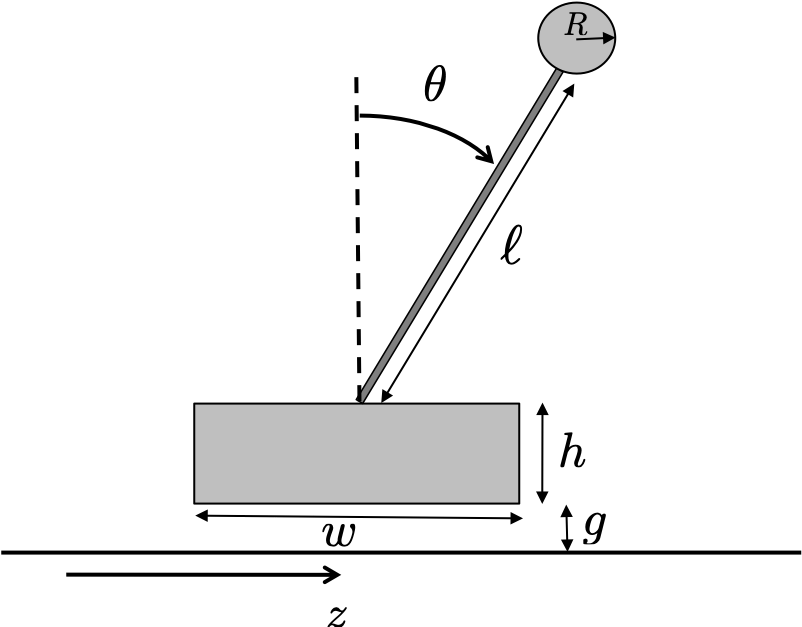
The first step in developing the animation is to determine the position of points that define the animation. For example, for the inverted pendulum in Fig. 3.8, the four corners of the base are \[(z+w/2, g), (z+w/2, g+h), (z-w/2, g+h), \text{ and } (z-w/2, g),\] and the two ends of the rod are given by \[(z, g+h) \text{ and } (z+L\sin\theta, g+h+L\cos\theta).\]
Since the base and the rod can move independently, each will need its
own figure handle. The drawBase command can be implemented
with the following MATLAB code:
function handle...
         = drawBase(z, width, height, gap, handle)
  X = [z-width/2,z+width/2,z+width/2,z-width/2];
  Y = [gap, gap, gap+height, gap+height];
  if isempty(handle),
    handle = fill(X,Y,'m');
  else
    set(handle,'XData',X,'YData',Y);
  end
Lines 2 and 3 define the X and Y locations of the corners of the
base. Note that in Line 1, handle is both an input and an
output. If an empty array is passed into the function, then the
fill command is used to plot the base in Line 5. On the
other hand, if a valid handle is passed into the function, then the base
is redrawn using the set command in Line 7.
The MATLAB code for drawing the rod is similar and is listed below.
function handle...
         = drawRod(z,theta,L,gap,height,handle)
  X = [z, z+L*sin(theta)];
  Y = [gap+height, gap + height + L*cos(theta)];
  if isempty(handle),
    handle = plot(X, Y, 'g');
  else
    set(handle,'XData',X,'YData',Y);
  end
The main routine for the pendulum animation is listed below.
function drawPendulum(u)
  %
  z        = u(1);
  theta    = u(2);
  t        = u(3);

  %
  L = 1;
  gap = 0.01;
  width = 1.0;
  height = 0.1;

  %
  persistent base_handle
  persistent rod_handle

  %
  %
  if t==0,
    figure(1), clf
    track_width=3;
    %
    plot([-track_width,track_width],[0,0],'k');
    hold on
    base_handle...
       =drawBase(z, width, height, gap, []);
    rod_handle...
       =drawRod(z, theta, L, gap, height, []);
    axis([-track_width,track_width,...
          -L,2*track_width-L]);
  %
  else
    drawBase(z, width, height, gap, base_handle);
    drawRod(z, theta, L, gap, height, rod_handle);
  end
The routine drawPendulum is called from the Simulink
file shown above, where there are three inputs: the position \(z\), the angle \(\theta\), and the time \(t\). Lines 3–5 rename the inputs to \(z\), \(\theta\), and \(t\). Lines 8–11 define the drawing
parameters. We require that the handle graphics persist between function
calls to drawPendulum. Since a handle is needed for both
the base and the rod, we define two persistent variables in Lines 14
and 15. The if statement in Lines 19–32 is used to produce
the animation. Lines 20–27 are called once at the beginning of the
simulation, and draw the initial animation. Line 20 brings the figure 1
window to the front and clears it. Lines 21 and 23 draw the ground along
which the pendulum will move. Line 25 calls the drawBase
routine with an empty handle as input, and returns the handle
base_handle to the base. Line 26 calls the
drawRod routine, and Line 25 sets the axes of the figure.
After the initial time step, all that needs to be changed are the
locations of the base and rod. Therefore, in Lines 30 and 31, the
drawBase and drawRod routines are called with
the figure handles as inputs.